--
MURPHY ANNUAL MARKET UPDATE
--
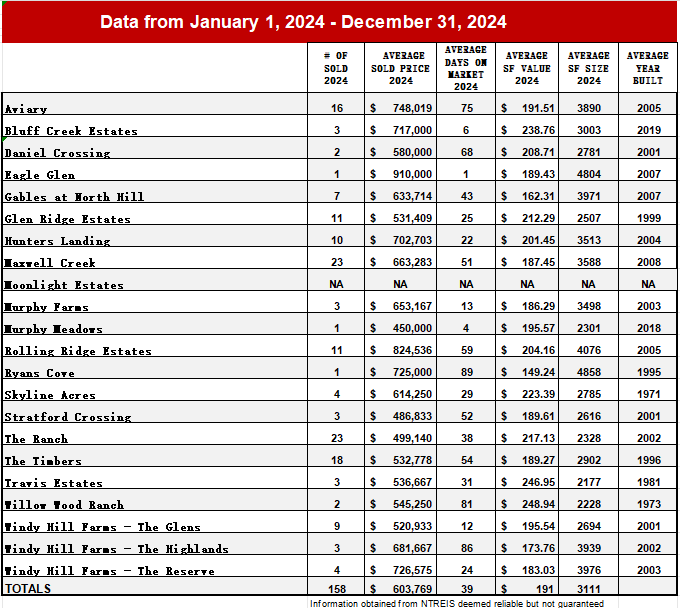
MURPHY ANNUAL MARKET UPDATE
| # OF SOLD 2025 | AVERAGE SOLD PRICE 2025 | AVERAGE DAYS ON MARKET 2025 | AVERAGE SF VALUE 2025 | AVERAGE SF SIZE 2025 | AVERAGE YEAR BUILT | |
|---|---|---|---|---|---|---|
| TOTALS | 155 | $612,171 | 58 | $198 | 3159 | |
| Aviary | 8 | $686,125 | 37 | $186.91 | 3748 | 2005 |
| Bluff Creek Estates | 1 | $690,000 | 32 | $229.77 | 3003 | 2019 |
| Crescent Hill | 6 | $885,833 | 79 | $273.30 | 3268 | 2025 |
| Daniel Crossing | 4 | $595,975 | 67 | $173.75 | 3452 | 2001 |
| Eagle Glen | 1 | $770,000 | 13 | $141.08 | 5458 | 2008 |
| Fairway Estates | 1 | $661,000 | 95 | $204.83 | 3227 | 2008 |
| Gables at North Hill | 8 | $611,856 | 43 | $173.88 | 3600 | 2009 |
| Glen Ridge Estates | 13 | $612,719 | 46 | $203.95 | 2543 | 2000 |
| Henry Maxwell | 1 | $550,000 | 14 | $278.34 | 1976 | 1995 |
| Hunters Landing | 7 | $750,286 | 50 | $200.68 | 3818 | 2005 |
| Maxwell Creek | 28 | $643,538 | 52 | $188.04 | 3467 | 2007 |
| Moonlight Estates | NA | NA | NA | NA | NA | NA |
| Murphy Farms | 5 | $592,987 | 38 | $178.71 | 3315 | 2001 |
| Murphy Meadows | 2 | $404,100 | 332 | $186.37 | 2215 | 2018 |
| Rolling Ridge Estates | 13 | $871,597 | 68 | $197.68 | 4420 | 2006 |
| Ryans Cove | NA | NA | NA | NA | NA | NA |
| Skyline Acres | 5 | $521,506 | 94 | $216.30 | 2457 | 1972 |
| Stratford Crossing | 3 | $532,467 | 58 | $188.52 | 2884 | 2000 |
| The Ranch | 15 | $457,627 | 56 | $209.52 | 2216 | 2004 |
| The Timbers | 22 | $489,795 | 56 | $189.24 | 2646 | 1997 |
| Travis Estates | 1 | $635,000 | 7 | $303.10 | 2095 | 1984 |
| Willow Wood Ranch | NA | NA | NA | NA | NA | NA |
| Windy Hill Farms - The Glens | 7 | $528,857 | 66 | $194.98 | 2767 | 2001 |
| Windy Hill Farms - The Highlands | 1 | $770,000 | 81 | $223.84 | 3440 | 2001 |
| Windy Hill Farms - The Reserve | 3 | $713,550 | 8 | $190.92 | 3730 | 2002 |
Information obtained from NTREIS deemed reliable but not guaranteed